Skip to product information


Sale price
€6,67
Regular price
€8,00
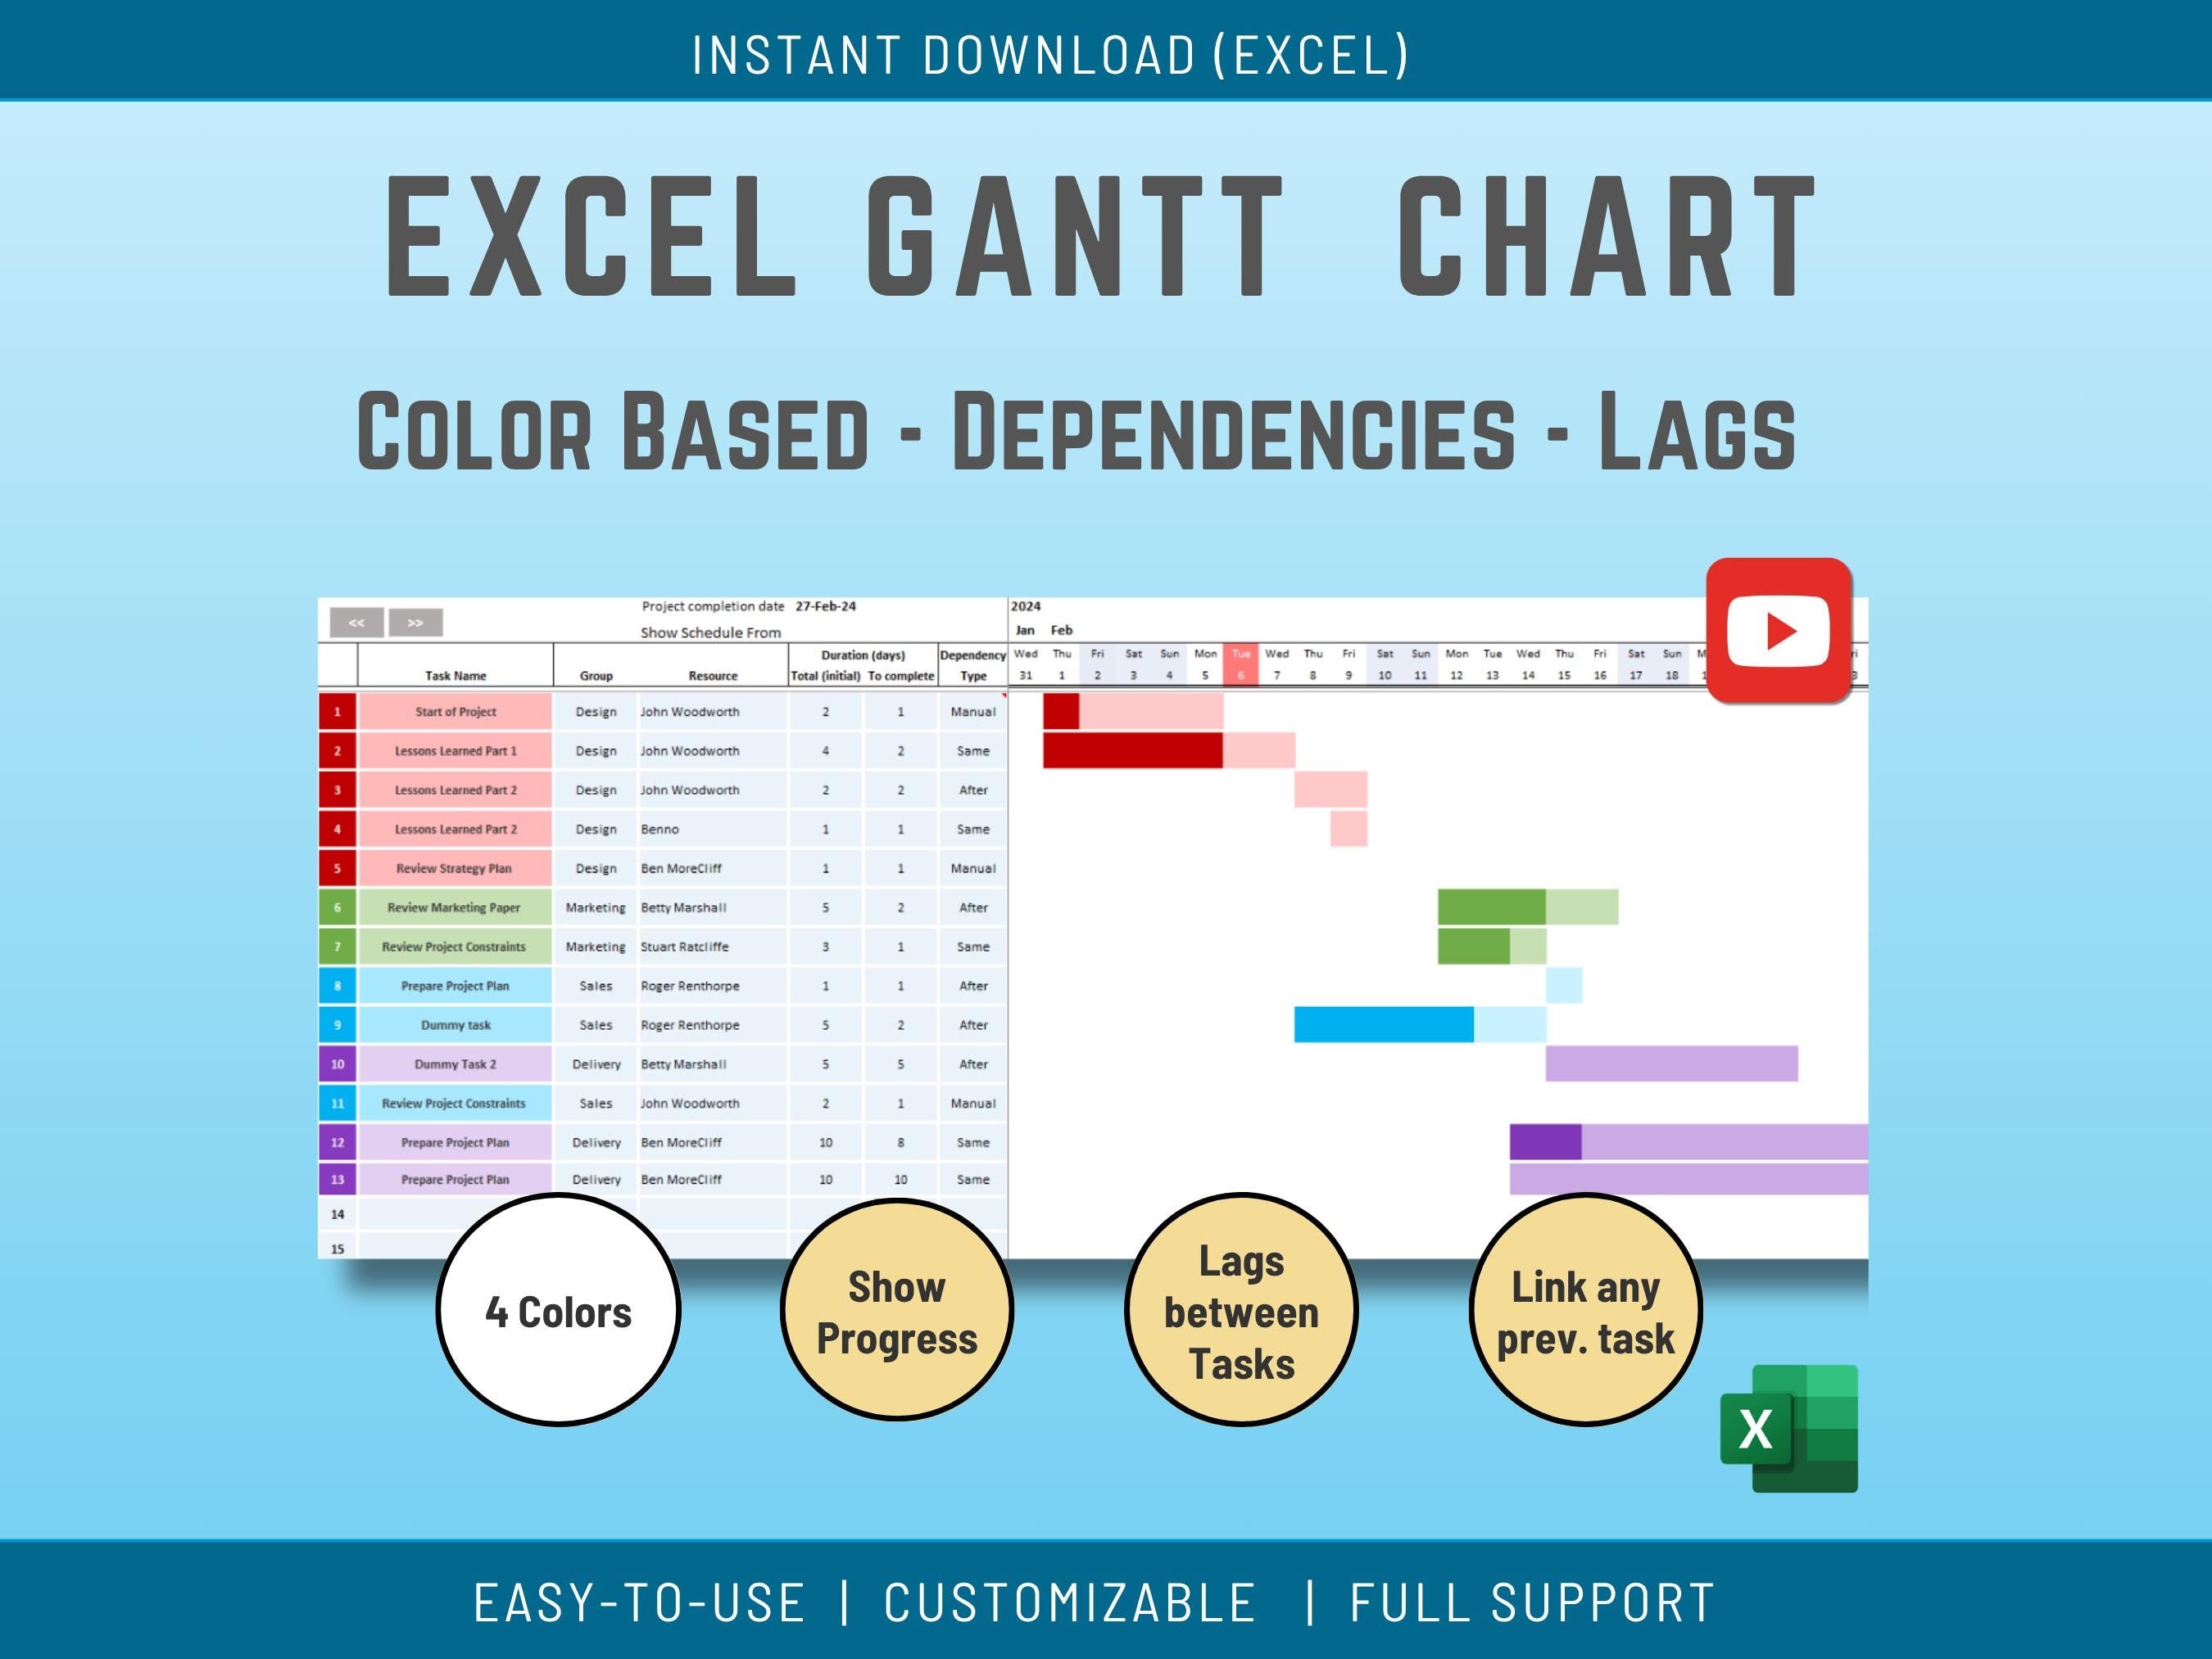
This Excel worksheet works as a Microsoft Gantt chart template with Dependencies, Delays and color allocation by group (4 colors). This tool allows yo to input Tasks, Resource names, dates, dependencies and delays. Also included some Statistical Data on Resourcing and Task Groups.
Full Tutorial/Demo of the Gantt Chart here:
https://youtu.be/M8t0-i6c7qk
Gantt Chart Scheduling tool in Excel. This version allows you to input up to 50 tasks, 15 resources and 4 Teams/Groups. Possibility to extend on Request.
Create and Manage colorful Gantt charts, visualizing task progress with 4 distinct color options. See how the tool generates comprehensive summaries by groups and resources, keeping you on top of project details. Collaboration is a breeze too – no macros means seamless sharing with your team. Discover how this Excel tool empowers you to manage projects with efficiency and a touch of fun!
✅𝙒𝙝𝙖𝙩'𝙨 𝙞𝙣𝙘𝙡𝙪𝙙𝙚𝙙
1 Microsoft EXCEL Spreadsheet fully Accessible - (safe - no macro).
✅𝙄𝙣𝙨𝙩𝙧𝙪𝙘𝙩𝙞𝙤𝙣𝙨
The Excel is not difficult to use, but I provide some basic instructions on how to use the Spreadsheet. You can also check the 30mn demo link I provide above.
✅𝙎𝙪𝙥𝙥𝙤𝙧𝙩
You get my full support with your purchase. I will provide you with my email address to enable you to contact me directly.