Skip to product information


Sale price
€4,10
Regular price
€5,00
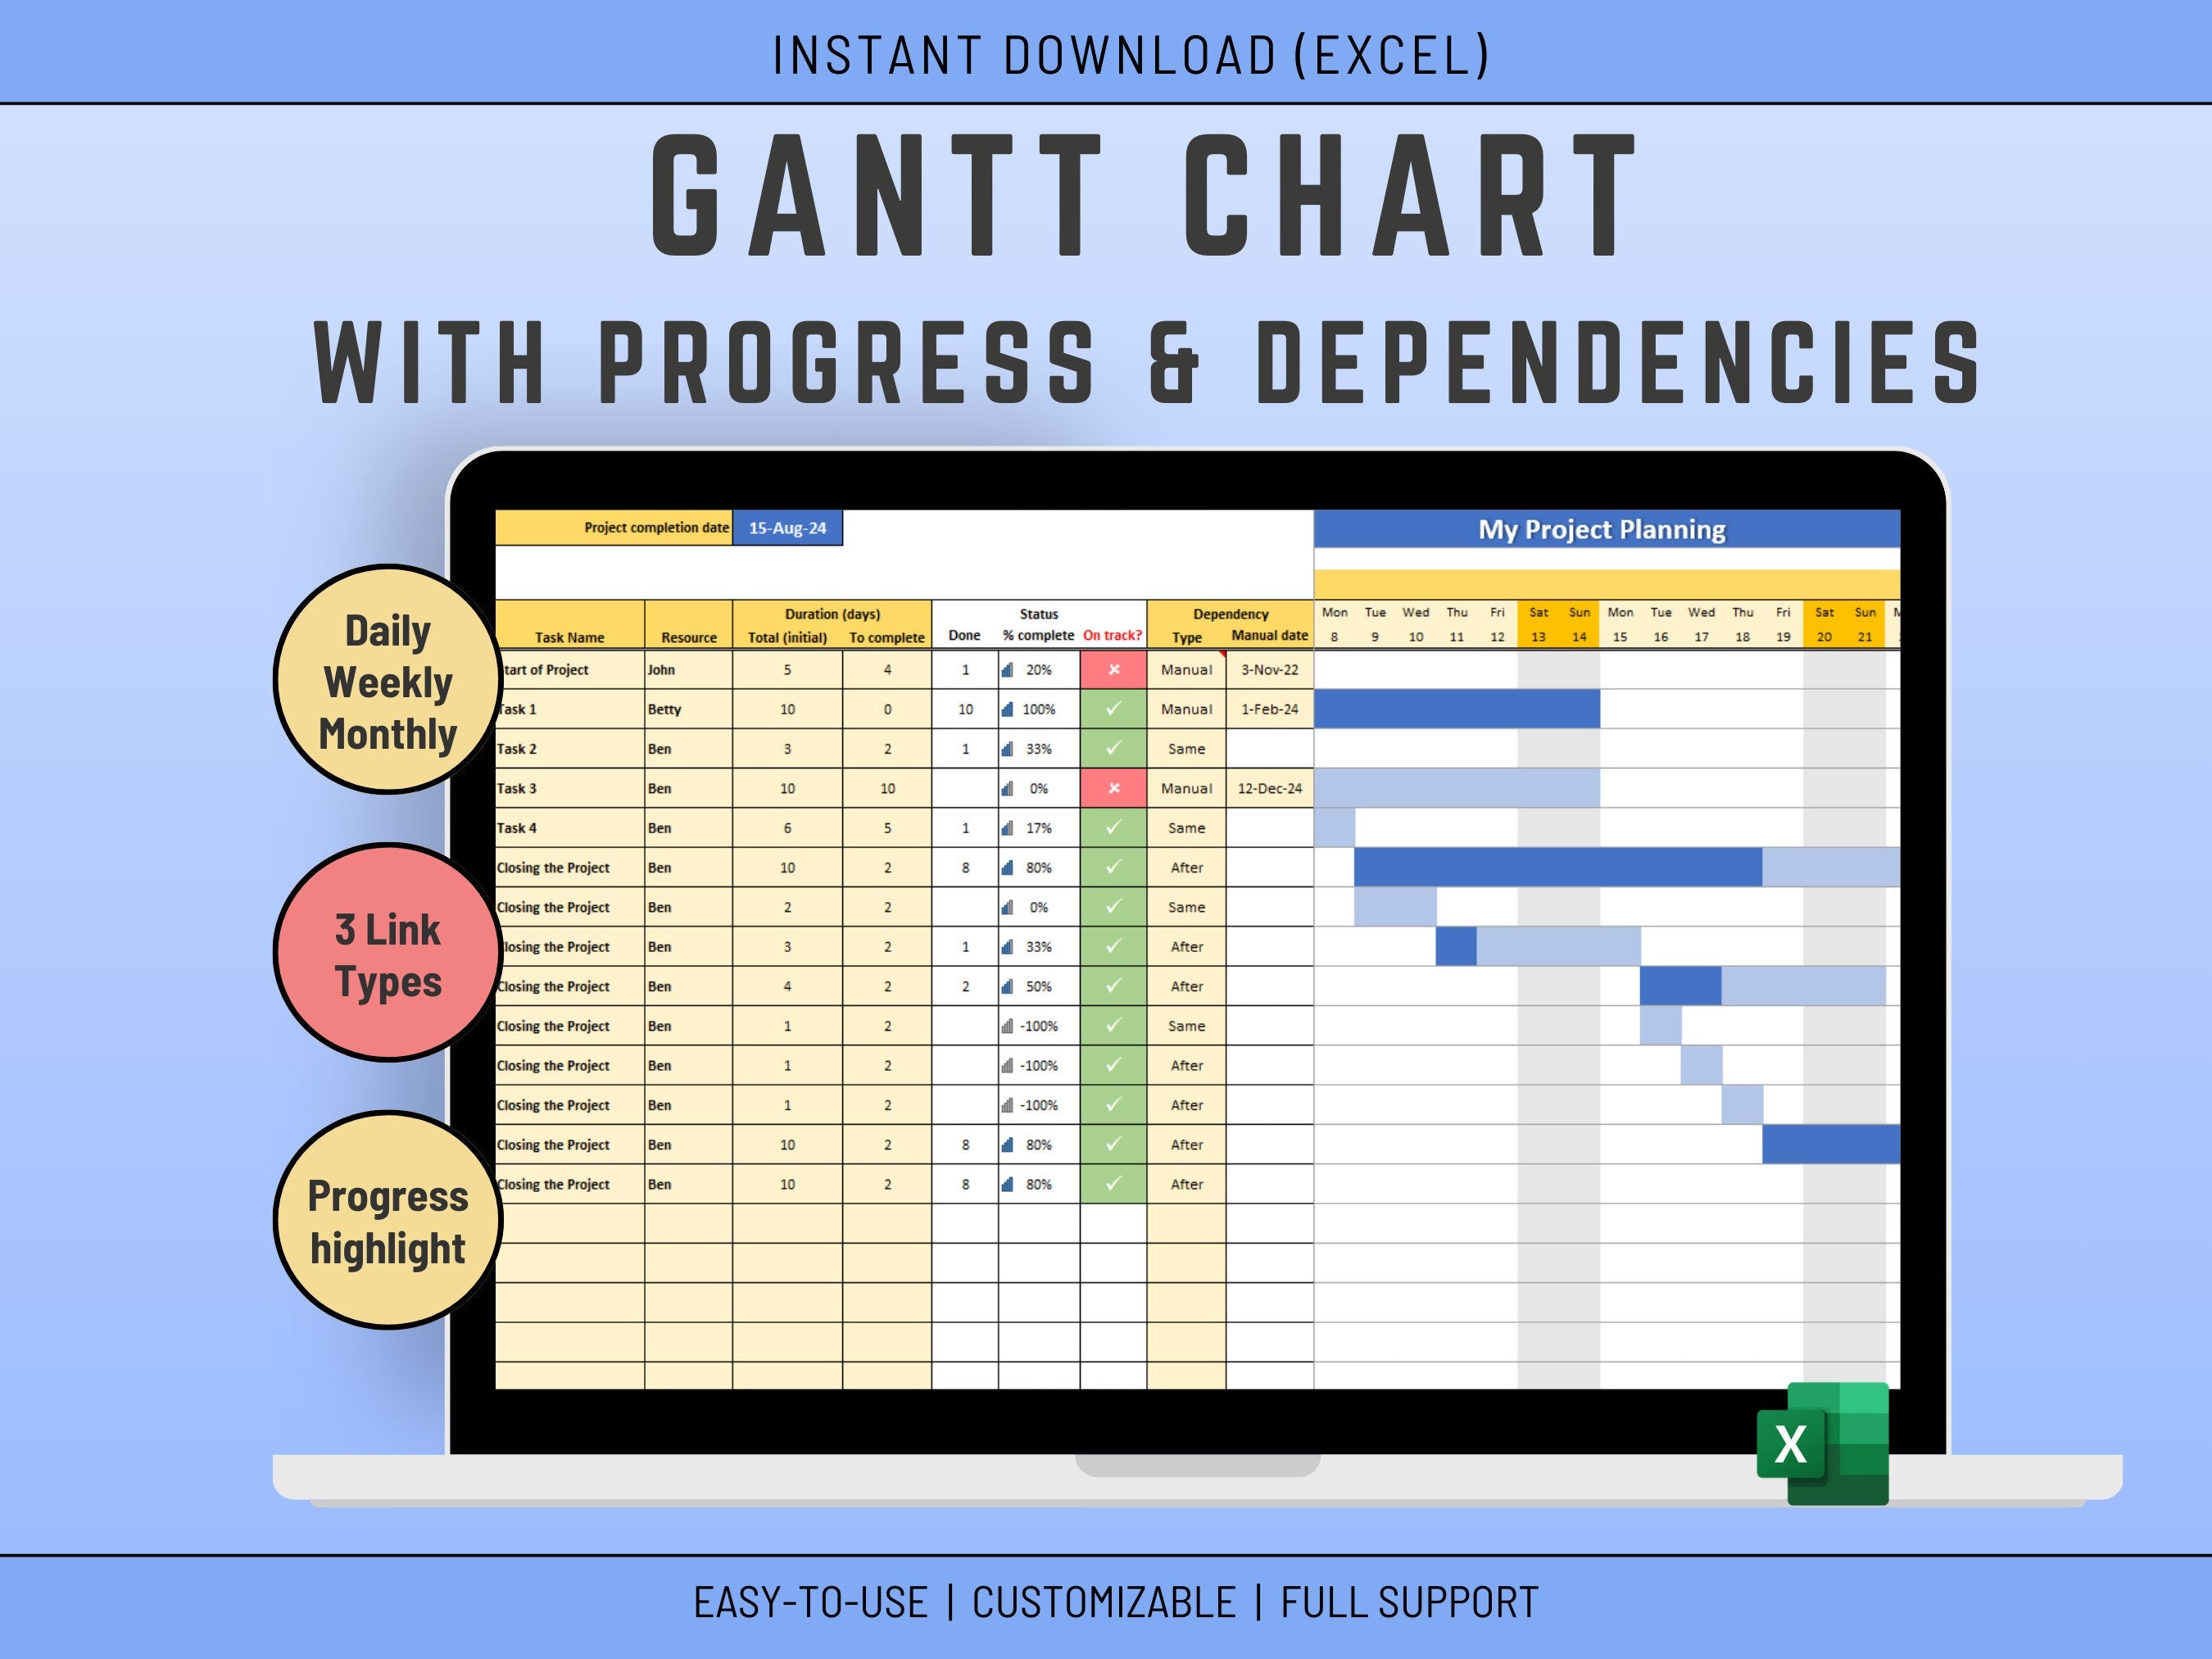
Transform Microsoft Excel into a wonderful Gantt Chart (MS Project like) for your Scheduling
Can't afford MS project but would like a simple way to visualise your tasks and calculate timeframes?
Please refer to the pics or Features List below for the full possibilities of this tool.
Please note:
The software can use dependency on tasks just before (For instance Task 2 is to take place after Task 1 - or start at the same time as Task 1 - only when Task 2 is directly after Task 1.
➡️ 𝙁𝙚𝙖𝙩𝙪𝙧𝙚𝙨
Scheduling
- 3 types of Dependency:
- Manual (i.e. choose manually the start date of the task (hard coded))
- After (The task will start just after the previous task)
- Same (The task will start at the same time as the previous task)
Gantt Chart
- The Gantt chart will highlight Week ends on top of the Gantt, and on the Gantt itself (only if there is no weekend work)
- The Gantt Chart will show progress on a task by using a stronger blue
Calculation done:
- The System will calculate the end date of all tasks (Project end date)
- The System will highlight if a task will be late based on today's date
- The System will estimate the Finish date for each task
- The System will calculate the "Done until" date for that task
- The System will calculate the % Completion for each task.
Customizing the Gantt Chart
- Can choose between Days, Weeks or Months per cell
- Can select if work is being done on weekend or not
- Can show grid or not
- Can show todays date on task or not
- Can decide from which date to show the schedule
✅𝙒𝙝𝙖𝙩'𝙨 𝙞𝙣𝙘𝙡𝙪𝙙𝙚𝙙
1 Microsoft EXCEL Spreadsheet fully Accessible
✅𝙄𝙣𝙨𝙩𝙧𝙪𝙘𝙩𝙞𝙤𝙣𝙨
The Excel is not difficult to use, but I provide some basic instructions on how to use the Spreadsheet.
✅𝙎𝙪𝙥𝙥𝙤𝙧𝙩
You get my full support with your purchase. I will provide you with my email address to enable you to contact me directly.