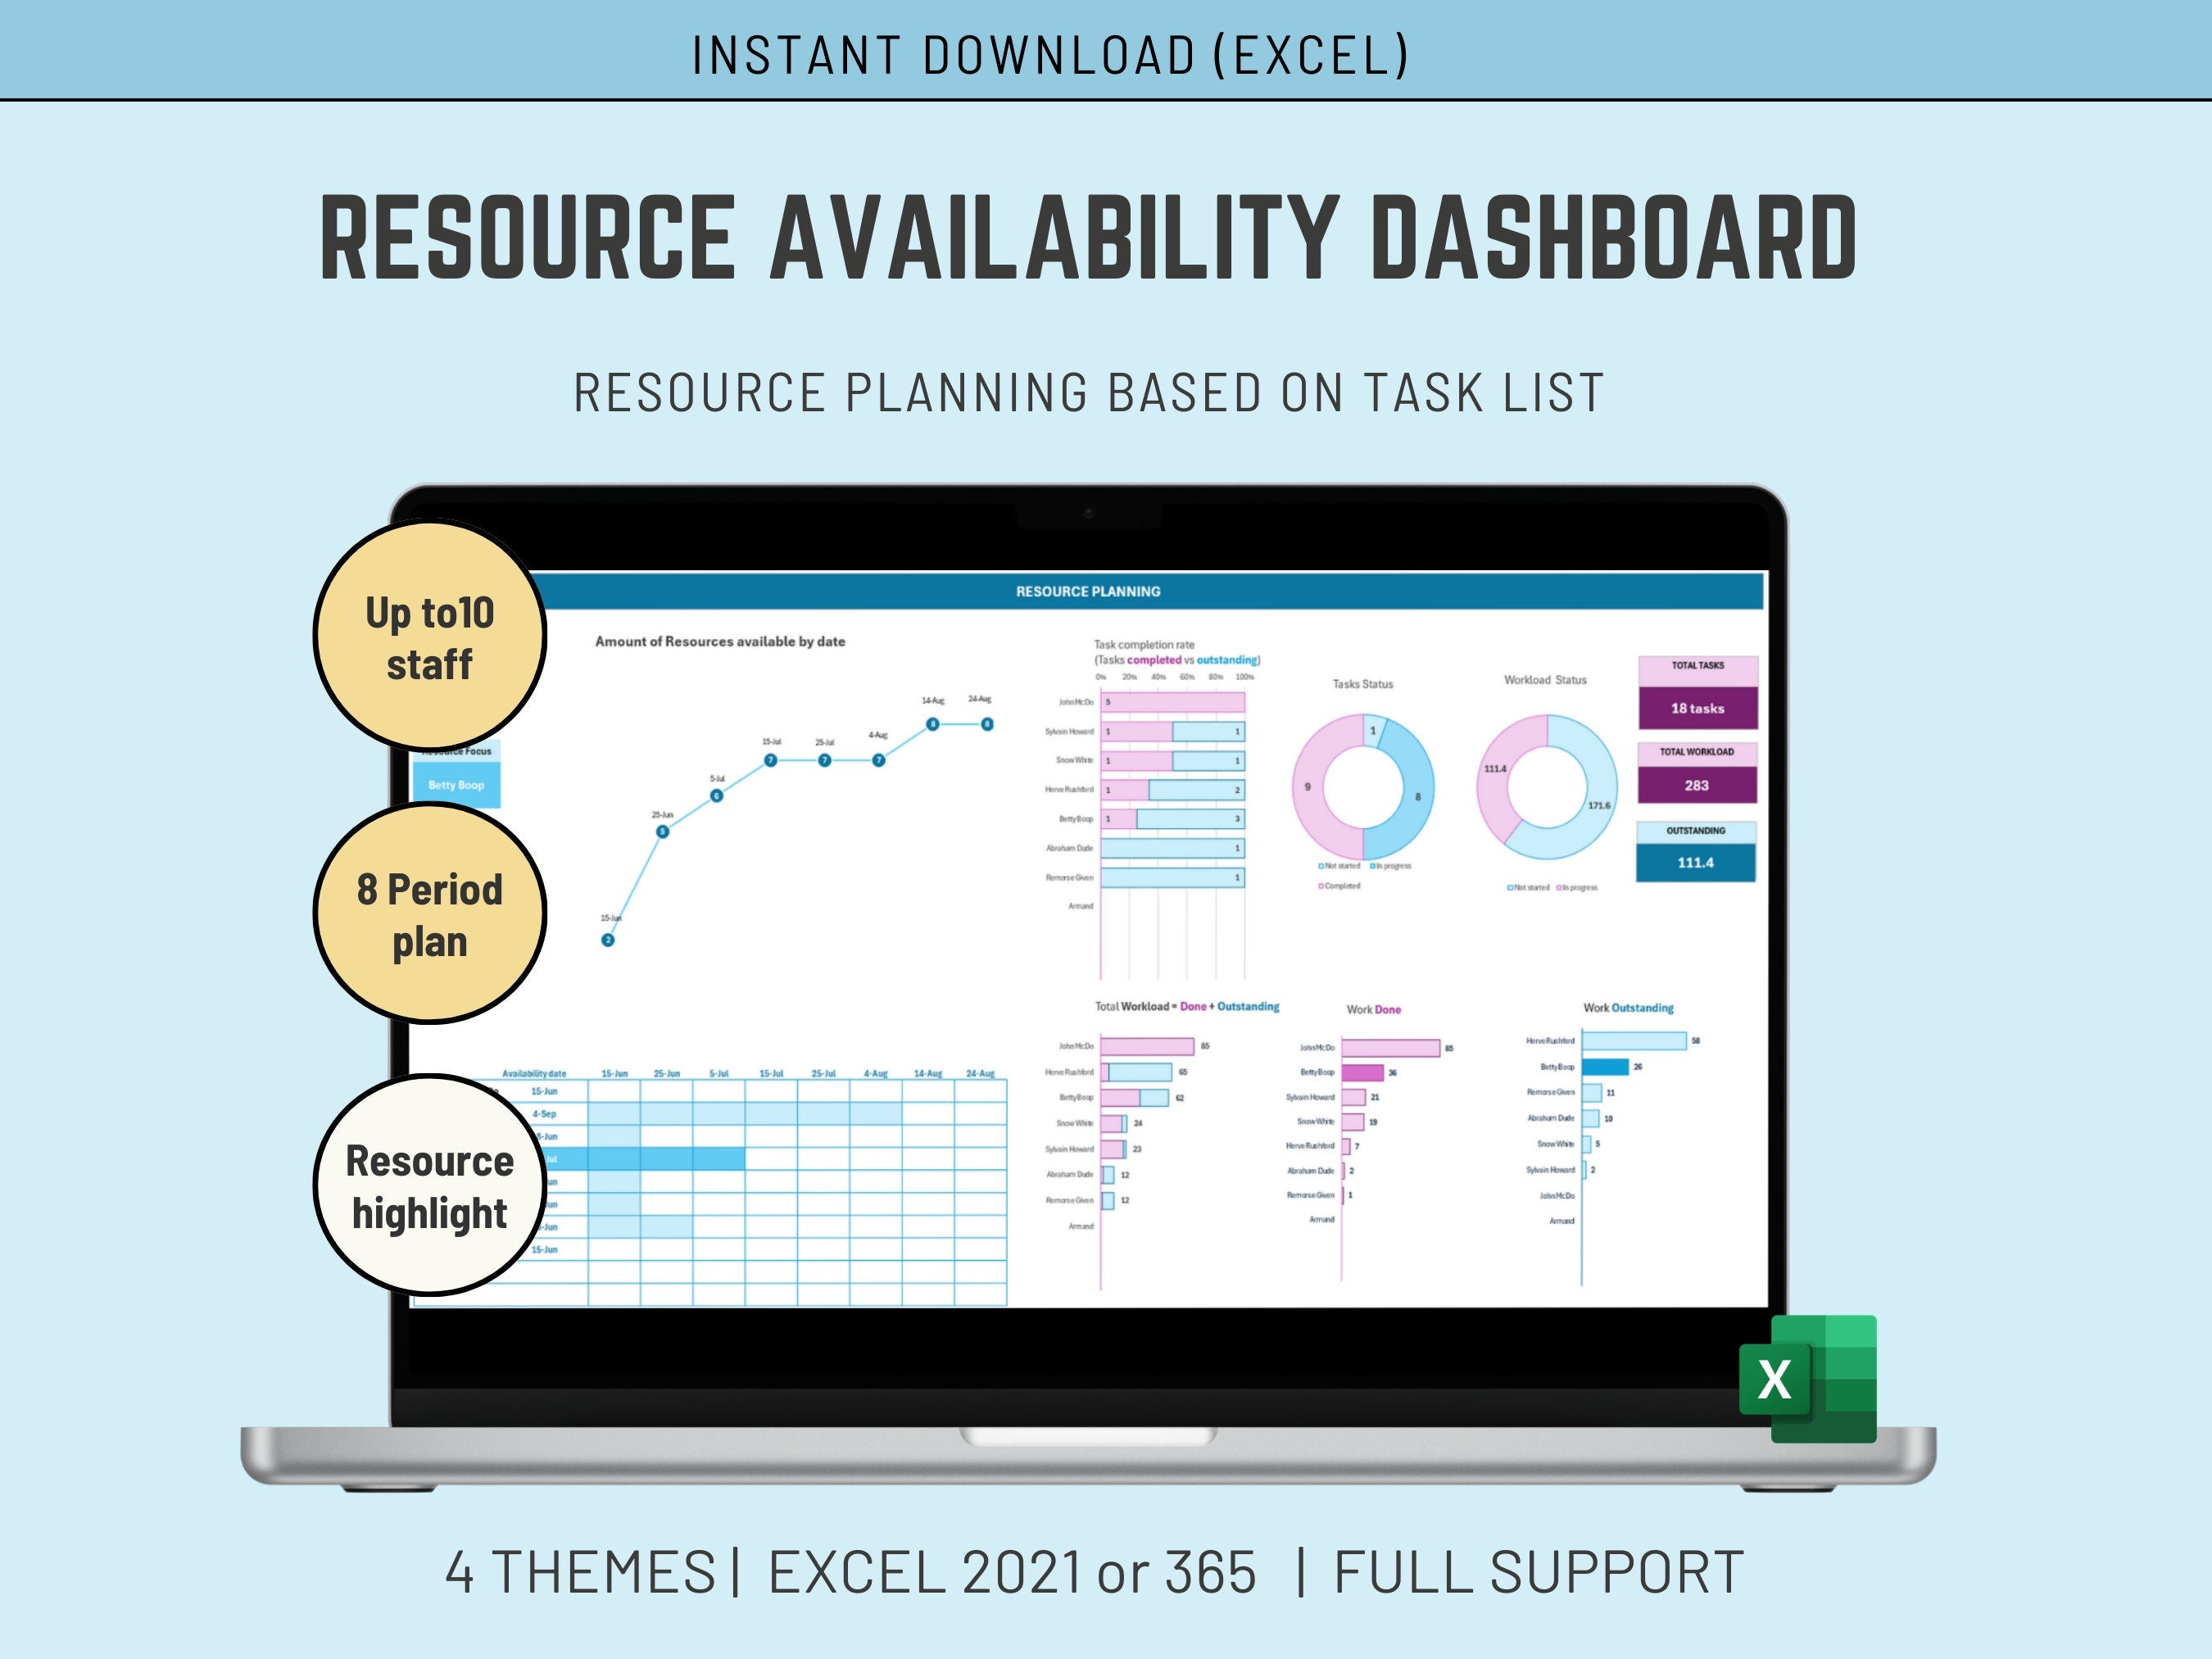
This Resource Availability Dashboard Excel template equips you with a powerful tool to manage your capacity Planning and manage your projects effectively.
𝘾𝙝𝙚𝙘𝙠 𝙩𝙝𝙚 𝙍𝙚𝙨𝙤𝙪𝙧𝙘𝙚 𝙈𝙖𝙣𝙖𝙜𝙚𝙢𝙚𝙣𝙩 𝘽𝙪𝙣𝙙𝙡𝙚 𝙝𝙚𝙧𝙚:
Resource Management bundle of 4 Templates including this one
Gain instant insights into:
- Work Completion %: Monitor the overall progress of your projects at a glance.
- Workload Breakdown: Analyze completed workload, outstanding tasks, and resource availability by date.
- Staff Performance: Track individual staff contributions with metrics like % tasks completed and workload completed by staff.
⚠️ Please note this Product requires Excel 2021 or Excel 365, as functions as SORT and FILTER are used:
🔎 𝙁𝙚𝙖𝙩𝙪𝙧𝙚𝙨:
1. Work Completion %:
Benefit: Get a quick and clear understanding of the overall progress on your projects. This high-level view helps you identify potential delays or areas requiring additional focus.
2. Total # of Tasks:
Benefit: Track the total number of tasks associated with your project. This metric provides a sense of scale and allows you to compare workload to progress over time.
3. Workload Completed:
Benefit: Monitor the amount of work already accomplished. This helps you gauge project progress and identify areas where your team is performing well.
4. Workload Outstanding:
Benefit: Visualize the remaining work on your project. Knowing what needs to be done allows you to prioritize tasks, allocate resources effectively, and track progress towards completion.
5. Resource Availability by Date:
Benefit: Ensure you have the necessary resources available to complete tasks on schedule. This can include personnel, equipment, or budget. By monitoring availability, you can identify potential bottlenecks and adjust your project plan accordingly.
6. % Tasks Completed by Staff:
Benefit: Track the individual performance of your team members. This metric helps you identify areas where staff may need additional support or highlight areas of exceptional work ethic.
7. Workload by Staff:
Benefit: Analyze the workload distribution across your team. This helps identify potential overallocation or underutilization of resources, allowing you to rebalance workloads for optimal efficiency.
8. Workload Completed by Staff:
Benefit: Gain insights into the individual contributions of your team members within the completed workload. This metric complements the % Tasks Completed by Staff by providing a more nuanced view of individual performance.
9. Task Completion %:
Benefit: Offer a more detailed breakdown of project progress beyond the overall Work Completion %. This metric allows you to track progress on specific tasks or phases within your project.
10. Workload Outstanding by Staff:
Benefit: Combine the insights from Outstanding Workload with Staff Workload to understand the remaining work allocation for each team member. This allows for targeted resource allocation and ensures everyone is focused on the right tasks.
By incorporating these metrics into your Excel dashboard, you gain a comprehensive understanding of your projects, allowing for better project planning, resource management, and ultimately, increased project success.
✅𝙒𝙝𝙖𝙩'𝙨 𝙞𝙣𝙘𝙡𝙪𝙙𝙚𝙙
4 Microsoft EXCEL Spreadsheet fully Accessible - each with different coloring.
✅𝙄𝙣𝙨𝙩𝙧𝙪𝙘𝙩𝙞𝙤𝙣𝙨
The Excel is not difficult to use, but I provide some basic instructions on how to use the Spreadsheet.
✅𝙎𝙪𝙥𝙥𝙤𝙧𝙩
You get my full support with your purchase. I will provide you with my email address to enable you to contact me directly.


