Skip to product information


Sale price
€4,00
Regular price
€5,00
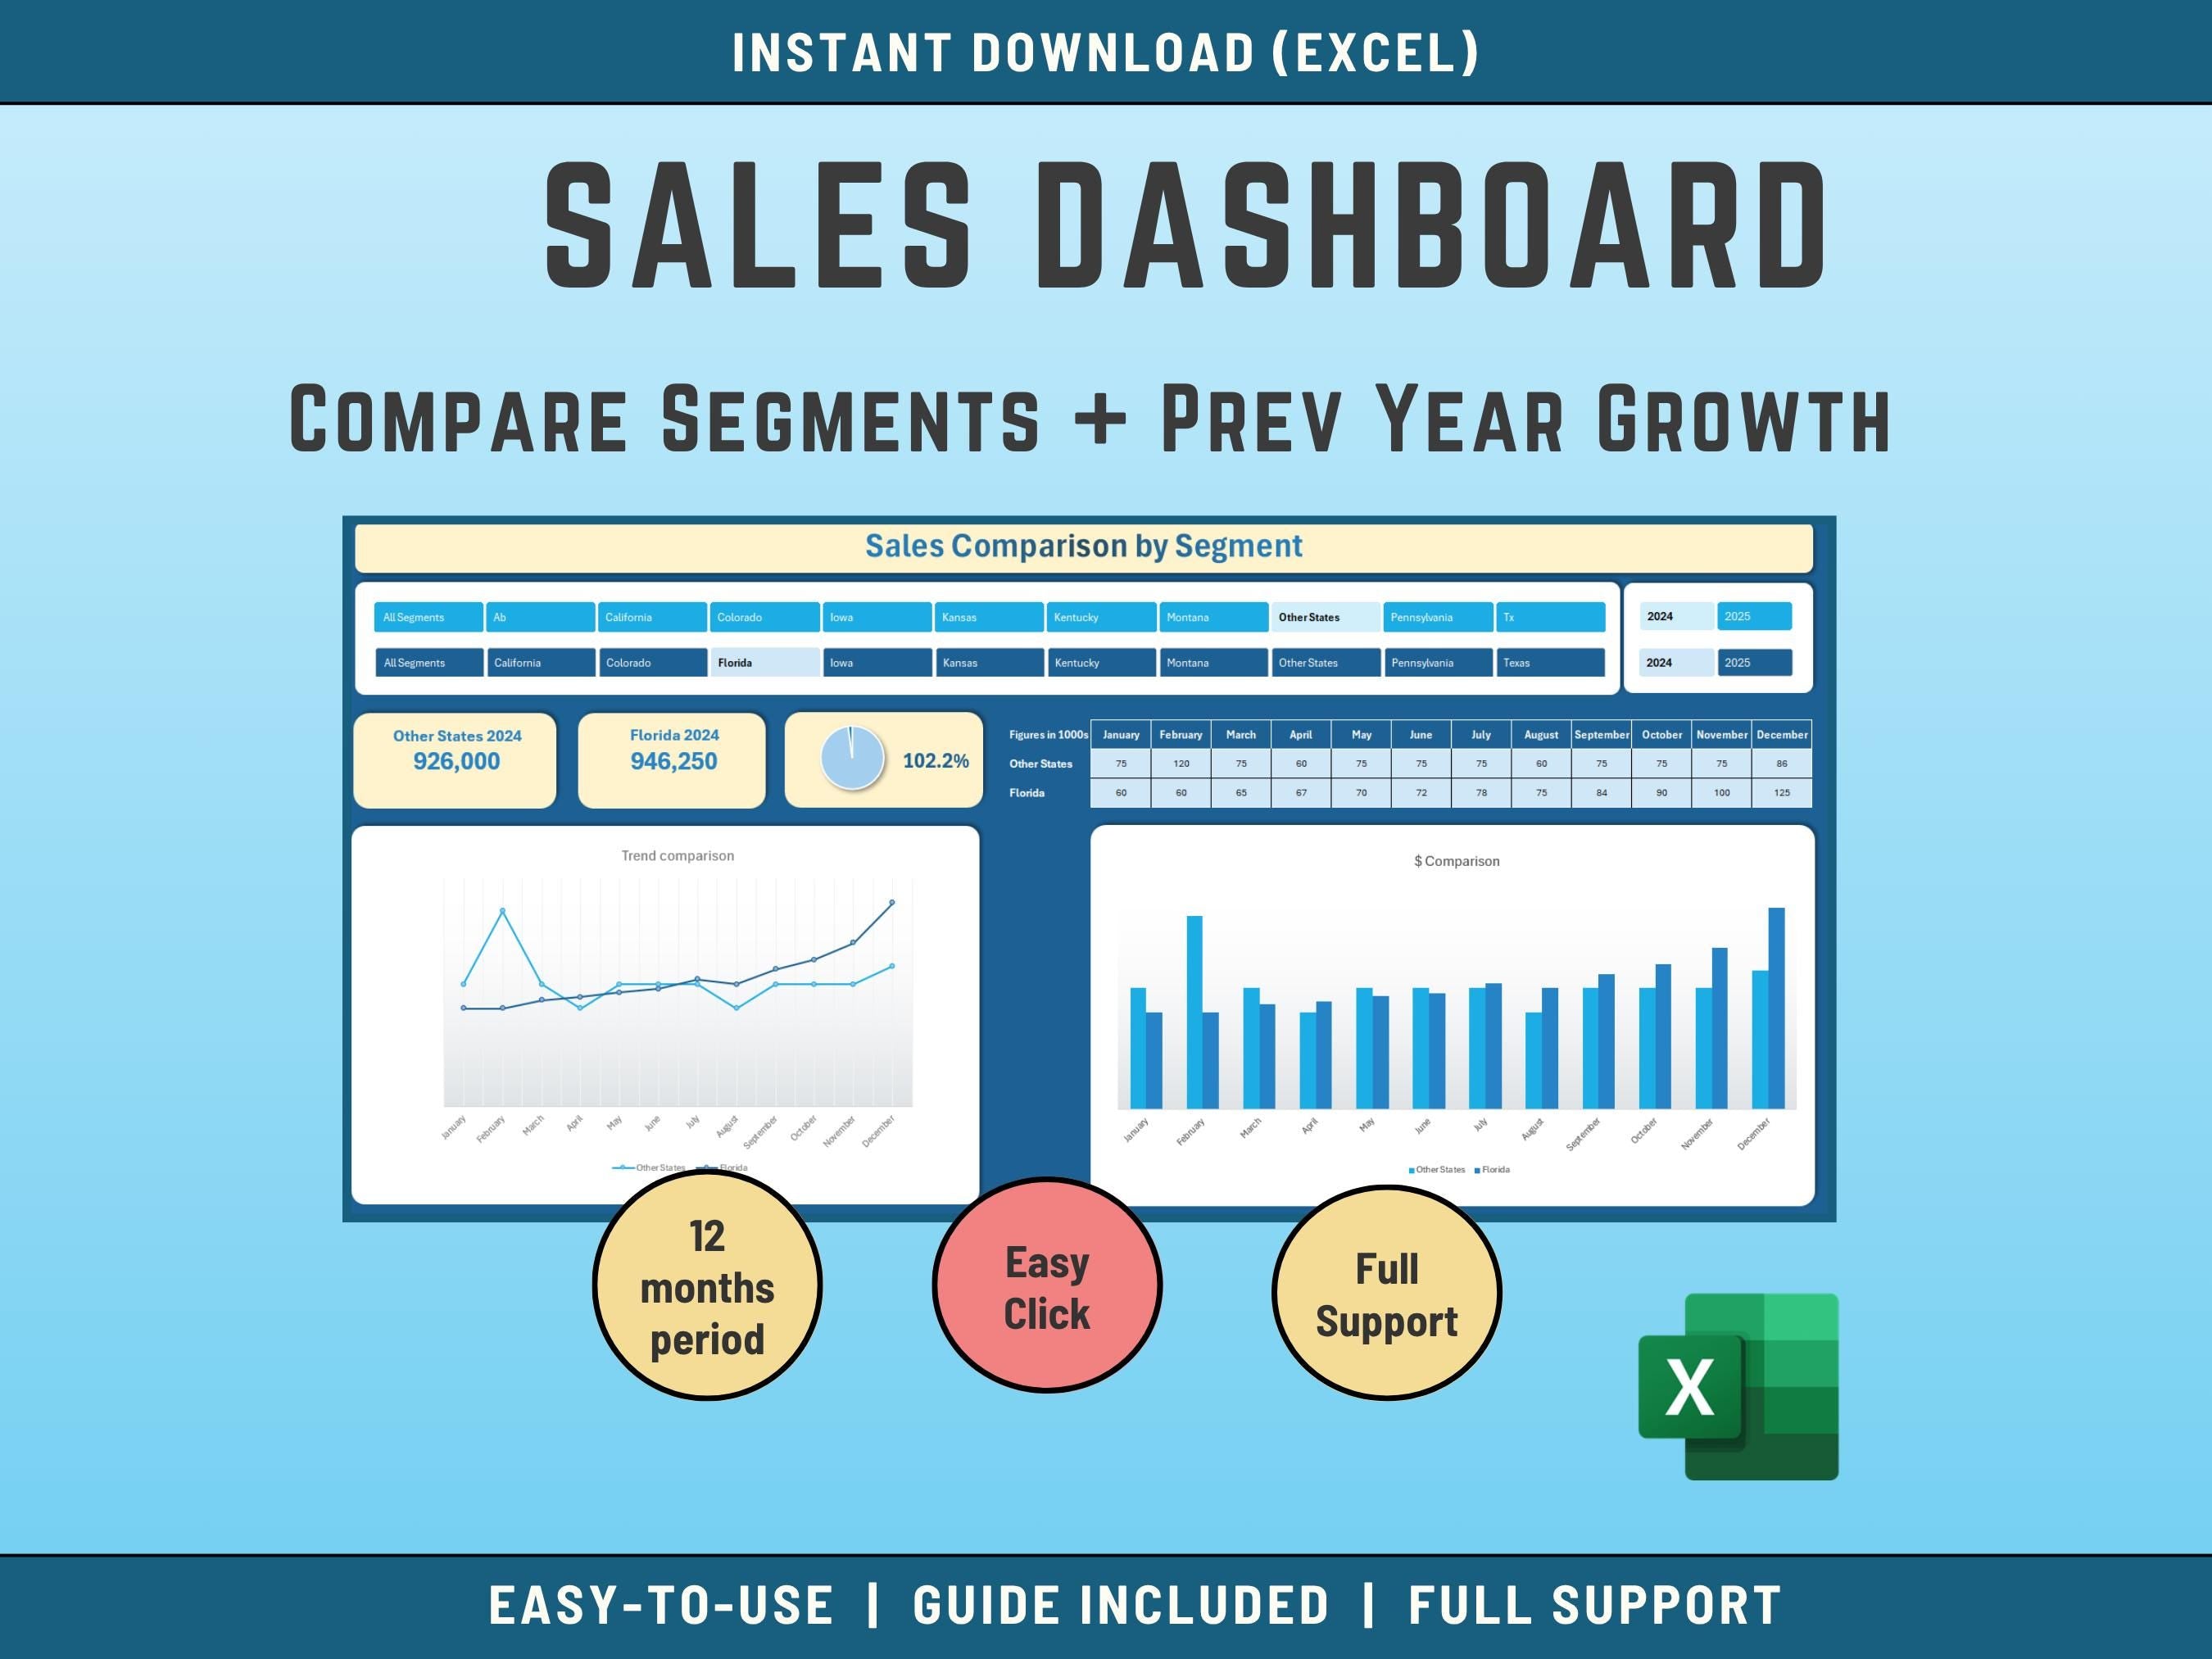
Excel template to visualize and compare Sales Data across Regions, Areas or Years.
Compares Sales Performance: Compare different regions and their contribution to total sales.
Analyzes Sales Trends: Uncover growth patterns and potential areas for improvement.
Optional: Compare Same Areas by duplicating same Year.
Key Features
Side-by-Side Segment Comparison:
Select and compare any two sales segments or geographic areas. Instantly see how different regions or product lines are performing.
Year-Over-Year Growth Tracking:
Analyze sales performance over a 12-month period and compare results with the previous year to identify growth trends and opportunities.
Interactive & Easy to Use:
No technical skills required! Simply enter your data, choose your segments and years, and watch the dashboard update automatically.
Clear Visualizations:
Dynamic charts and graphs make it easy to spot trends, outliers, and areas for improvement at a glance.
Flexible Data Input:
Works with any segmentation—by state, region, product, or custom categories. Compare two segments from the same year or different years.
Instant Download & Full Support:
Get started immediately with your purchase. Includes a step-by-step guide and dedicated support to help you make the most of your dashboard.
If you are unsure on how it works - please contact me before purchase.
✅𝙒𝙝𝙖𝙩'𝙨 𝙞𝙣𝙘𝙡𝙪𝙙𝙚𝙙
1 Microsoft EXCEL Spreadsheet fully Accessible
✅𝙄𝙣𝙨𝙩𝙧𝙪𝙘𝙩𝙞𝙤𝙣𝙨
The Excel is not difficult to use, but I provide some basic instructions on how to use the Spreadsheet.
✅𝙎𝙪𝙥𝙥𝙤𝙧𝙩
You get my full support with your purchase. I will provide you with my email address to enable you to contact me directly.